
Fitxategi:Mauna Loa Carbon Dioxide-en.svg

Bereizmen handikoa (SVG fitxategia, nominaldi 850 × 547 pixel, fitxategiaren tamaina: 16 KB)
Fitxategi hau Wikimedia Commonsekoa da. Hango deskribapen orriko informazioa behean duzu. |
Laburpena
| Deskribapena |
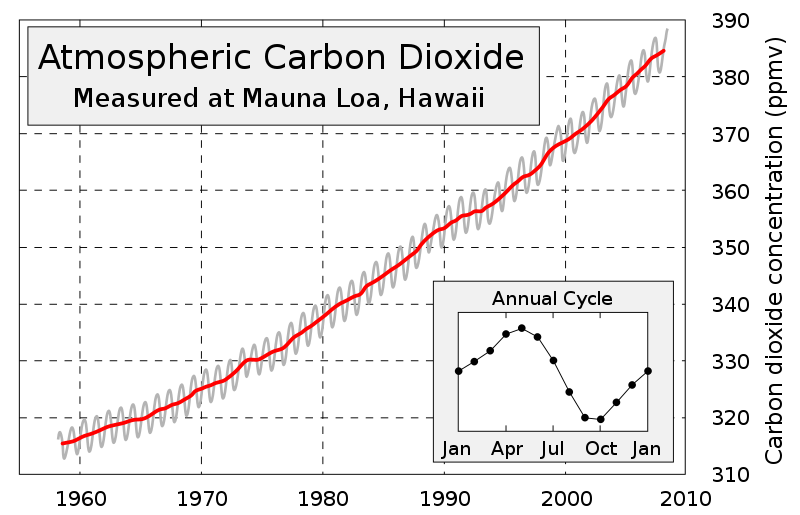
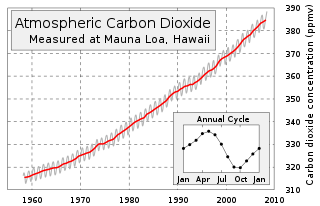
English: This figure shows the history of atmospheric carbon dioxide concentrations as directly measured at Mauna Loa, Hawaii. This curve is known as the Keeling curve, and is an essential piece of evidence of the man-made increases in greenhouse gases that are believed to be the cause of global warming. The longest such record exists at Mauna Loa, but these measurements have been independently confirmed at many other sites around the world [1].
The annual fluctuation in carbon dioxide is caused by seasonal variations in carbon dioxide uptake by land plants. Since many more forests are concentrated in the Northern Hemisphere, more carbon dioxide is removed from the atmosphere during Northern Hemisphere summer than Southern Hemisphere summer. This annual cycle is shown in the inset figure by taking the average concentration for each month across all measured years. The grey curve shows the average monthly concentrations, and red curve is a moving 12 month average.Français : Évolution de la teneur atmosphérique en dioxyde de carbone, mesurée depuis le volcan Mauna Loa, dans l'île de Hawaii. La courbe de cette évolution est connue sous le nom de « courbe de Keeling », et est une preuve évidente de la production humaine de gaz à effet de serre et de son impact sur le réchauffement climatique. C'est sur le Mauna Loa que les taux mesurés sont les plus élevés, mais on retrouve la même évolution sur d'autres sites dans le monde (voir ici).
La fluctuation annuelle de dioxyde de carbone est dûe aux variation saisonnière causées par les plantes. Comme beaucoup de forêts se trouvent dans l'hémisphère nord, il y a plus de rejet de gaz carbonique dans l'atmosphère durant l'été septentrional que pendant l'été austral. Ce cycle annuel est indiqué dans l'encart en bas à droite de l'image, et montre la concentration moyenne de gaz au cours des différents mois. Ce cycle se répète quelle que soit l'année observée. La courbe grise montre la teneur moyenne mensuelle de dioxyde de carbone, et la courbe rouge représente la moyenne annuelle. |
||
| Data | |||
| Jatorria | Image:Mauna Loa Carbon Dioxide.png, uploaded in Commons by Nils Simon under licence GFDL & CC-NC-SA ; itself created by Robert A. Rohde from NOAA published data and is incorporated into the Global Warming Art project. | ||
| Egilea | Sémhur | ||
| Beste bertsioak |
[]
Updated version (2015)
| ||
| Aitortu (required by the license) | © Sémhur / Wikimedia Commons / | ||
| SVG | W3C-validity not checked. Fitxategi hau (bektore-irudia) hau Inkscape-ekin sortu da .
.
|
||
| Graphic Lab |

| Kameraren kokapena | | Irudi hau eta gehiago beraien kokapenekin hurrengo lekuetan: OpenStreetMap |
|---|
Lizentzia
| Copyleft: This work of art is free; you can redistribute it and/or modify it according to terms of the Free Art License. You will find a specimen of this license on the Copyleft Attitude site as well as on other sites. |
- Askea zara:
- partekatzeko – lana kopiatzeko, banatzeko eta bidaltzeko
- birnahasteko – lana moldatzeko
- Ondorengo baldintzen pean:
- eskuduntza – Egiletza behar bezala aitortu behar duzu, lizentzia ikusteko esteka gehitu, eta ea aldaketak egin diren aipatu. Era egokian egin behar duzu hori guztia, baina inola ere ez egileak zure lana edo zure erabilera babesten duela irudikatuz.
- berdin partekatu – Lan honetan oinarrituta edo aldatuta berria eraikitzen baduzu, emaitza lana hau bezalako lizentzia batekin argitaratu behar duzu.
Fitxategiaren historia
Data/orduan klik egin fitxategiak orduan zuen itxura ikusteko.
| Data/Ordua | Iruditxoa | Neurriak | Erabiltzailea | Iruzkina | |
|---|---|---|---|---|---|
| oraingoa | 12:19, 29 ekaina 2008 | | 850 × 547 (16 KB) | Sémhur | clean-up |
| 11:30, 27 ekaina 2008 |  | 850 × 547 (31 KB) | Sémhur | Data updated (now, from 1958 to june 2008) | |
| 15:51, 23 apirila 2008 |  | 800 × 547 (33 KB) | Sémhur | Without the bitmap, it's better | |
| 15:48, 23 apirila 2008 |  | 800 × 547 (33 KB) | Sémhur | {{Information |Description= {{en|This figure shows the history of atmospheric carbon dioxide concentrations as directly measured at Mauna Loa, Hawaii. This curve is known as the [ |
Irudira dakarten loturak
Ez dago fitxategi hau darabilen orririk.
Fitxategiaren erabilera orokorra
Hurrengo beste wikiek fitxategi hau darabilte:
- af.wikipedia.org proiektuan duen erabilera
- ar.wikipedia.org proiektuan duen erabilera
- en.wikipedia.org proiektuan duen erabilera
- fr.wikipedia.org proiektuan duen erabilera
- ko.wikipedia.org proiektuan duen erabilera
- zh.wikipedia.org proiektuan duen erabilera