
Fitxategi:Csch sech coth.svg

SVG fitxategi honen PNG aurreikuspenaren tamaina: 504 × 504 pixel. Bestelako bereizmenak: 240 × 240 pixel | 480 × 480 pixel | 768 × 768 pixel | 1.024 × 1.024 pixel | 2.048 × 2.048 pixel.
Bereizmen handikoa (SVG fitxategia, nominaldi 504 × 504 pixel, fitxategiaren tamaina: 18 KB)
Fitxategi hau Wikimedia Commonsekoa da. Hango deskribapen orriko informazioa behean duzu. |
Laburpena
| Deskribapena |
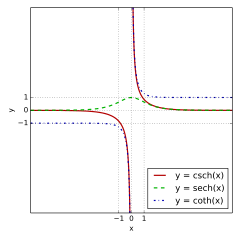
The hyperbolic cosecant (red), hyperbolic secant (green) and hyperbolic cotangent (blue) graphed on the same axes. Replaces Csch sech coth.png.
|
| Data | |
| Jatorria | Norberak egina |
| Egilea | Fylwind at ingelesa Wikipedia |
| SVG genesis | Fitxategi hau (bektore-irudia) hau Matplotlib-ekin sortu da . |
| Iturburu kode | Python codeimport numpy as np
import matplotlib.pyplot as plt
def clip(ys, limit):
return np.ma.masked_where(np.abs(ys) > limit, ys)
lim = 8
size = 5.6
fig, ax = plt.subplots(figsize=(size, size))
xs = np.linspace(-lim, lim, 1000)
ax.plot(xs, clip(1 / np.sinh(xs), lim * 2), label="y = csch(x)",
color="#b30000", linestyle="-", linewidth=2)
ax.plot(xs, 1 / np.cosh(xs), label="y = sech(x)",
color="#00b300", linestyle="--", linewidth=2)
ax.plot(xs, clip(1 / np.tanh(xs), lim * 2), label="y = coth(x)",
color="#0000b3", linestyle="-.", linewidth=2)
ax.set_xlim(-lim, lim)
ax.set_ylim(-lim, lim)
ax.set_xticks([-1, 0, 1])
ax.set_yticks([-1, 0, 1])
ax.set_xlabel("x")
ax.set_ylabel("y")
ax.grid("on")
ax.legend(loc="lower right")
fig.tight_layout()
fig.savefig("csch_sech_coth.svg", transparent=True)
|
Lizentzia
| Nik, lan honen egile eskubideen jabeak, lan hau domeinu publikoan jartzen dut. Mundu osoan du eragina honek. Estatu batzuetan beharbada hori ez da legez posible izango. Halakoetan: Edonori ematen diot lan hau edozertarako erabiltzeko eskubidea, inolako baldintzarik gabe, legeak nahitaez ezarritako baldintzak izan ezik. |
Jatorrizko igoera erregistroa
(All user names refer to en.wikipedia)
- 2006-03-14 10:38 Ktims 1600×1200×0 (10563 bytes) The hyperbolic cosecant (red), hyperbolic secant (green) and hyperbolic cotangent (blue) graphed on the same axes.
- 2006-03-14 10:35 Ktims 1600×1200×0 (13176 bytes) The hyperbolic cosecant (red), hyperbolic secant (green) and hyperbolic cotangent (blue) graphed on the same axes.
Fitxategiaren historia
Data/orduan klik egin fitxategiak orduan zuen itxura ikusteko.
| Data/Ordua | Iruditxoa | Neurriak | Erabiltzailea | Iruzkina | |
|---|---|---|---|---|---|
| oraingoa | 01:20, 11 martxoa 2016 | | 504 × 504 (18 KB) | Fylwind | Try again to fix the clipping problem |
| 01:03, 11 martxoa 2016 |  | 504 × 504 (31 KB) | Fylwind | Try to fix SVG clipping bug | |
| 00:53, 11 martxoa 2016 |  | 504 × 504 (22 KB) | Fylwind | Make the asymptotic behavior more evident from the graph. | |
| 02:38, 6 otsaila 2007 |  | 1.600 × 1.200 (15 KB) | Alejo2083 | dashed lines | |
| 02:33, 6 otsaila 2007 |  | 1.600 × 1.200 (10 KB) | Alejo2083 | {{Information |Description=The hyperbolic cosecant (red), hyperbolic secant (green) and hyperbolic cotangent (blue) graphed on the same axes. Replaces en::Image:Csch_sech_coth.png. == Instructions == Generated with en:gnuplot using the script |
Irudira dakarten loturak
Hurrengo orrialdeek dute fitxategi honetarako lotura:
Fitxategiaren erabilera orokorra
Hurrengo beste wikiek fitxategi hau darabilte:
- ar.wikipedia.org proiektuan duen erabilera
- az.wikipedia.org proiektuan duen erabilera
- ba.wikipedia.org proiektuan duen erabilera
- bg.wikipedia.org proiektuan duen erabilera
- bs.wikipedia.org proiektuan duen erabilera
- ca.wikipedia.org proiektuan duen erabilera
- cs.wikipedia.org proiektuan duen erabilera
- el.wikipedia.org proiektuan duen erabilera
- en.wikipedia.org proiektuan duen erabilera
- eo.wikipedia.org proiektuan duen erabilera
- fa.wikipedia.org proiektuan duen erabilera
- hi.wikipedia.org proiektuan duen erabilera
- hu.wikipedia.org proiektuan duen erabilera
- hy.wikipedia.org proiektuan duen erabilera
- id.wikipedia.org proiektuan duen erabilera
- is.wikipedia.org proiektuan duen erabilera
- it.wikipedia.org proiektuan duen erabilera
- km.wikipedia.org proiektuan duen erabilera
- ko.wikipedia.org proiektuan duen erabilera
- mk.wikipedia.org proiektuan duen erabilera
- nn.wikipedia.org proiektuan duen erabilera
- ro.wikipedia.org proiektuan duen erabilera
- ru.wikipedia.org proiektuan duen erabilera
- simple.wikipedia.org proiektuan duen erabilera
- si.wikipedia.org proiektuan duen erabilera
- sq.wikipedia.org proiektuan duen erabilera
- ta.wikipedia.org proiektuan duen erabilera
- tr.wikipedia.org proiektuan duen erabilera
- vi.wikipedia.org proiektuan duen erabilera
- wuu.wikipedia.org proiektuan duen erabilera
- zh.wikipedia.org proiektuan duen erabilera