Fitxategi:1000 Year Temperature Comparison.png

Orriaren edukia ez da onartzen beste hizkuntza batzuetan.
Wikipedia, Entziklopedia askea

1000_Year_Temperature_Comparison.png((599 × 442 pixel, fitxategiaren tamaina: 32 KB, MIME mota: image/png))

Fitxategi hau Wikimedia Commonsekoa da. Hango deskribapen orriko informazioa behean duzu.
Commons gordailu bat da, lizentzia askea duten multimedia fitxategiena. Lagun dezakezu.

Fitxategi hau Wikimedia Commonsekoa da
Irudi hau birsortu beharko litzateke SVG irudi bektorial moduan. Honek abantaila asko ematen ditu, ikus Commons:Media for cleanup (ingelesez) informazio gehiagorako. Irudi honen SVG bertsioa eskuragarri badago, mesedez Commonsera igo. Igo ostean, ordezkatu txantiloi hau txantiloi honegatik {{vector version available|irudiaren izen berria.svg}} irudi honetan.

Laburpena

Deskribapena
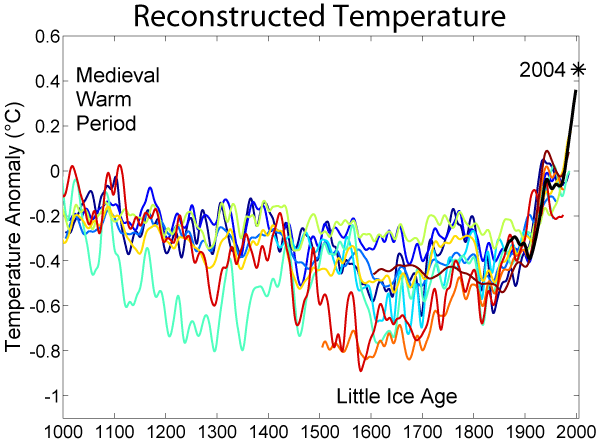
English: This image is a comparison of 10 different published reconstructions of mean temperature changes during the 2nd millennium. More recent reconstructions are plotted towards the front and in redder colors, older reconstructions appear towards the back and in bluer colors. An instrumental history of temperature is also shown in black. The medieval warm period and little ice age are labeled at roughly the times when they are historically believed to occur, though it is still disputed whether these were truly global or only regional events. The single, unsmoothed annual value for 2004 is also shown for comparison. (Image:Instrumental Temperature Record.png shows how 2004 relates to other recent years).

It is unknown which, if any, of these reconstructions is an accurate representation of climate history; however, these curves are a fair representation of the range of results appearing in the published scientific literature. Hence, it is likely that such reconstructions, accurate or not, will play a significant role in the ongoing discussions of global climate change and global warming.

For each reconstruction, the raw data has been decadally smoothed with a σ = 5 yr Gaussian weighted moving average. Also, each reconstruction was adjusted so that its mean matched the mean of the instrumental record during the period of overlap. The variance (i.e. the scale of fluctuations) was not adjusted (except in one case noted below).

Except as noted below, all original data for this comparison comes from here and links therein. It should also be noted that many reconstructions of past climate report substantial error bars, which are not represented on this figure.
Data
Jatorria http://www.globalwarmingart.com/wiki/File:1000_Year_Temperature_Comparison.png
Egilea Robert A. Rohde
Beste bertsioak

Reconstructions

The reconstructions used, in order from oldest to most recent publication are:

  1. (dark blue 1000-1991): The Holocene.
  2. (blue 1000-1980): Geophysical Research Letters.
  3. (light blue 1000-1965): Ambio. Modified as published in Science.
  4. (lightest blue 1402-1960): J. Geophys. Res..
  5. (light green 831-1992): Science.
  6. (yellow 200-1980): Geophysical Research Letters. doi:10.1029/2003GL017814.
  7. (orange 200-1995): Reviews of Geophysics. doi:10.1029/2003RG000143
  8. (red-orange 1500-1980): Geophys. Res Lett.. doi:10.1029/2004GL019781
  9. (red 1-1979): Nature. doi:10.1038/nature03265
  10. (dark red 1600-1990): Science. doi:10.1126/science.1107046

(black 1856-2004): Instrumental data was jointly compiled by the Climatic Research Unit and the UK Meteorological Office Hadley Centre. Global Annual Average data set TaveGL2v [1] was used.

Documentation for the most recent update of the CRU/Hadley instrumental data set appears in: Journal of Climate.

Lizentzia

The original version of this figure was prepared by Robert A. Rohde from publicly available data and is incorporated into the Global Warming Art project.

Image from Global Warming Art
This image is an original work created for Global Warming Art. Please refer to the Year Temperature Comparison.png image description page for more information.
GNU head Baimena duzu dokumentu hau kopiatu, banatu edo/eta aldatzeko GNU Free Documentation License baldintzapean, Free Software Foundationek argitaratutako 1.2 edo ondorengo bertsioan; sekzio aldaezinik gabe, azaleko testurik gabe, eta atzeko azaleko testurik gabe. Lizentziaren kopia dago GNU Free Documentation License izenburudun atalean.
w:eu:Creative Commons
eskuduntza berdin partekatu
Fitxategi hau Creative Commons Attribution-Share Alike 3.0 Unported lizentziapean dago.
Askea zara:
  • partekatzeko – lana kopiatzeko, banatzeko eta bidaltzeko
  • birnahasteko – lana moldatzeko
Ondorengo baldintzen pean:
  • eskuduntza – Egiletza behar bezala aitortu behar duzu, lizentzia ikusteko esteka gehitu, eta ea aldaketak egin diren aipatu. Era egokian egin behar duzu hori guztia, baina inola ere ez egileak zure lana edo zure erabilera babesten duela irudikatuz.
  • berdin partekatu – Lan honetan oinarrituta edo aldatuta berria eraikitzen baduzu, emaitza lana hau bezalako lizentzia batekin argitaratu behar duzu.
This licensing tag was added to this file as part of the GFDL licensing update.


Notes

  1. Data from Moberg et al. was taken directly from the supplemental information accompanying the Nature article.
  2. Data for Oerlemans was provided by William M. Connolley.
  3. Esper et al. reported only fluctuations in "arbitrary" units, so the variance in this record was rescaled to match the variance during the period of overlap with the instrumental record.
  4. When a paper included multiple reconstructions, the global annually average temperature data was used. If this was not reported, then Northern Hemisphere annually averaged data was used.
  5. Four records appearing at [2] were not used in preparing this graph for the following reasons:
    1. Mann et al. 98 was not included because Mann et al. 99 extended and updated that record.
    2. Briffa et al. 98 was not included because Briffa et al. 2001 extended and updated that record.
    3. Pollack et al. 98 was not included because the reported data was not found to be in a form that allowed for easy replotting.
    4. Mann et al. 2000 was not used because it did not include an original reconstruction covering at least the Northern Hemisphere.


Dragons flight's Temperature Record Series
This figure is part of a series of plots created by Dragons flight to illustrate
changes in Earth's temperature and climate across many different time scales.
Time Period: 25 yrs | 150 yrs | 1 kyr | 2 kyr | 12 kyr | 450 kyr | 5 Myr | 65 Myr | 500 Myr
For articles related to this topic see: Temperature record

Irudi-oineko testuak

Add a one-line explanation of what this file represents

Fitxategi honetan agertzen diren itemak

honako hau irudikatzen du

18 azaroa 2005

media type ingelesa

image/png

checksum ingelesa

896104465de636e551cb77de82d0892e1e892551

data size ingelesa

32.749 Byte

442 pixel

599 pixel

Fitxategiaren historia

Data/orduan klik egin fitxategiak orduan zuen itxura ikusteko.

Data/OrduaIruditxoaNeurriakErabiltzaileaIruzkina
oraingoa01:14, 22 azaroa 201901:14, 22 azaroa 2019 bertsioaren iruditxoa599 × 442 (32 KB)MyridiumSomebody updated the image with a "2016" label that isn't even included in the data analysed! Data analysed only goes up to 2004.
08:54, 5 maiatza 201908:54, 5 maiatza 2019 bertsioaren iruditxoa599 × 500 (48 KB)TobusUpdate to show 2016 temperature anomaly
19:10, 16 uztaila 201419:10, 16 uztaila 2014 bertsioaren iruditxoa599 × 442 (32 KB)JeffyPShrinkin' the image.
00:51, 18 abendua 200500:51, 18 abendua 2005 bertsioaren iruditxoa599 × 442 (40 KB)Saperaud~commonswiki*'''Description:''' [[en:Image:{{subst:PAGENAME}}]]

Ez dago fitxategi hau darabilen orririk.

Fitxategiaren erabilera orokorra

Hurrengo beste wikiek fitxategi hau darabilte: