
Fitxategi:Butterworth filter bode plot.png

Aurreikuspen honen neurria: 800 × 560 pixel. Bestelako bereizmenak: 320 × 224 pixel | 640 × 448 pixel | 1.024 × 717 pixel | 1.250 × 875 pixel.
Bereizmen handikoa ((1.250 × 875 pixel, fitxategiaren tamaina: 110 KB, MIME mota: image/png))
Fitxategi hau Wikimedia Commonsekoa da. Hango deskribapen orriko informazioa behean duzu. |
Laburpena
| Deskribapena |
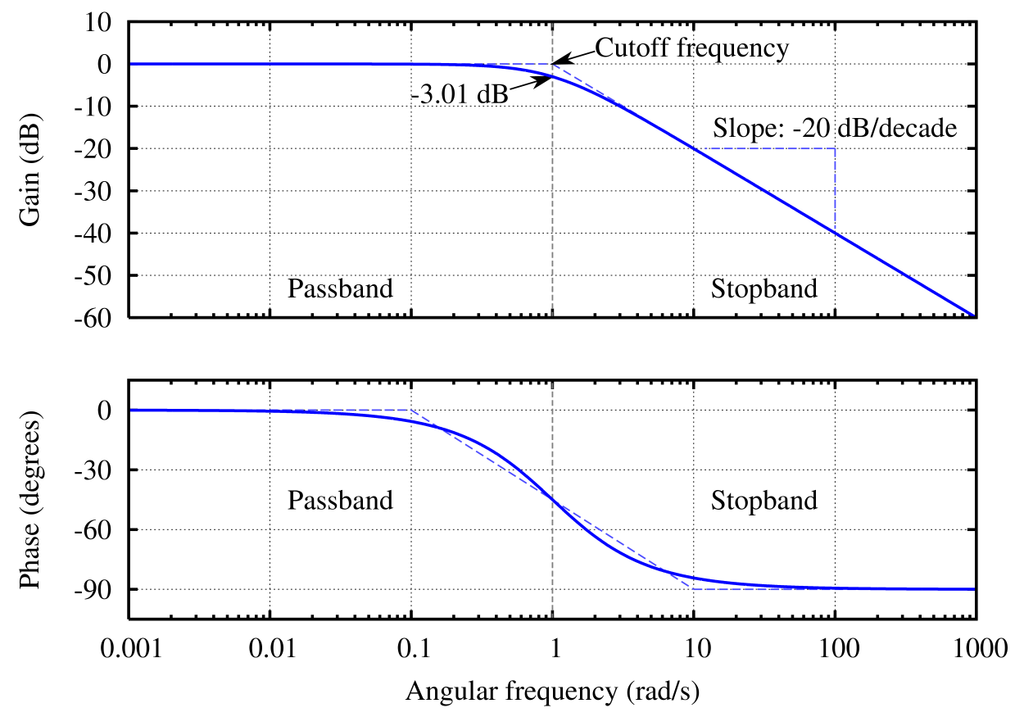
English: The Bode plot of a Butterworth filter with logarithmic axes and various labels. Cutoff frequency is normalized to 1 rad/s. Gain is normalized to 0 dB in the passband. Phase is in degrees because that's typical. The code is kind of kludgy, but makes a good output. See Wikipedia graph-making tips. Generated in gnuplot with the script below (save as butterworth_bode_plot.plt and then open in gnuplot). Then I opened the butterworth_bode_plot.ps file in a text editor to edit the line colors and linestyles, as per this description. This avoids needing to open in proprietary software, and really isn't that difficult (especially if you don't know the commands in the proprietary software either). ;-) Identify the lines easily by their color (the arrow is currently magenta and I want it to be black. Ah, there is the entry with 1 0 1, red + blue = magenta) or by using the gnuplot linestyle−1. (For instance, gnuplot's linestyle 3 corresponds to the ps file's /LT2.) Then you can edit the colors and dashes by hand. I changed the original: /LT0 { PL [] 1 0 0 DL } def
/LT1 { PL [4 dl 2 dl] 0 1 0 DL } def
/LT2 { PL [2 dl 3 dl] 0 0 1 DL } def
/LT3 { PL [1 dl 1.5 dl] 1 0 1 DL } def
into this: /LT0 { PL [] 0 0 1 DL } def
/LT1 { PL [4 dl 2 dl] 0.5 0.5 0.5 DL } def
/LT2 { PL [6 dl 3 dl] 0.3 0.3 1 DL } def
/LT3 { PL [] 0 0 0 DL } def
/LT4–/LT8 I left unchanged. (I don't know what they're used for anyway.) /LTw, /LTb, and /LTa are for the grid lines and such. To convert the PostScript file to PNG:
|
| Data | 2005ko urriaren 8a (igoera data) |
| Jatorria | Norberak egina |
| Egilea | Omegatron |
| Beste bertsioak |
[]
.png:
|
| gnuplot source | click to expand
set samples 2001
set terminal postscript enhanced landscape color lw 2 "Times-Roman" 20
set output "butterworth bode plot.ps"

# Butterworth amplitude response and decibel calculation.  n is the order, which is just 1 in this image.
G(w,n) = 1 / (sqrt(1 + w**(2*n)))
dB(x) = 20 * log10(abs(x))
# Phase is for first order
P(w) = -pi/2-atan(1.2*w)-atan(0.09*w)

# Gridlines
set grid

# Set x axis to logarithmic scale
set logscale x 10

# No need for a key
set nokey #0.1,-25

# Frequency response's line plotting style
set style line 1 lt 1 lw 2

# Asymptote lines and slope lines are the same "arrow" style
set style line 3 lt 3 lw 1
set style arrow 3 nohead ls 3

# -3 dB arrow style
set style line 4 lt 4 lw 1
set style arrow 4 head filled size screen 0.02,15,45 ls 4

# Separator between passband and stopband line style
set style line 2 lt 2 lw 1
set style arrow 2 nohead ls 2

set multiplot

# Magnitude response
# =============================================
set size 1,0.5
set origin 0,0.5

# Set range of x and y axes
set xrange [0.001:1000]
set yrange [-60:10]

# Create x-axis tic marks once per decade (every multiple of 10)
set xtics 10
#set ytics 10

# No need for two sets of numbers
set format x ""

# Use 10 x-axis minor divisions per major division
set mxtics 10

# Axis labels
set ylabel "Gain (dB)"

# Draw asymptote lines
set arrow 1 from 1,0 to 1000,-60 as 3
set arrow 2 from .001,0 to 1,0 as 3

# -3 dB arrow
set arrow 4 from 2,3 to 1,0 as 4

# "Cutoff frequency" label uses same coordinates as the function
set label 3 "Cutoff frequency" at 2,4 l

# "-3 dB" label
set arrow 5 from 0.5,-6 to 1,-3 as 4
set label 4 "-3.01 dB" at 0.5,-7 r

# Draw a separator between passband and stopband and label them
set arrow 3 from 1,-60 to 1,10 as 2

# Label coordinates are relative to the graph window, not to the function, centered at the 1/4 and 3/4 width points
set label 1 "Passband" at graph 0.25, graph 0.1 c
set label 2 "Stopband" at graph 0.75, graph 0.1 c

# Draw slope lines and label
set arrow 6 from 100,-20 to 12,-20 as 3
set arrow 7 from 100,-20 to 100,-39 as 3
set label 5 "Slope: -20 dB/decade" at 100,-15 c

plot dB(G(x,1)) ls 1  title "1st-order response"

#Phase response
# =============================================
set size 1,0.5
set origin 0,0

# Set range of x and y axes
set yrange [-105:15]

# Create y-axis tic marks every 15 degrees
set ytics 30

# Regular numbers
set format x "% g"

# Axis labels
set ylabel "Phase (degrees)"
set xlabel "Angular frequency (rad/s)"

# Draw asymptote lines
set arrow 1 from 0.1,0 to 10,-90 as 3
set arrow 2 from 0.001,0 to 0.1,0 as 3
set arrow 10 from 10,-90 to 1000,-90 as 3

# -3 dB arrow
unset arrow 4 #from 2,3 to 1,0 as 4

# "Cutoff frequency" label uses same coordinates as the function
unset label 3 #"Cutoff frequency" at 2,4 l

# "-3 dB" label
unset arrow 5 #from 0.5,-6 to 1,-3 as 4
unset label 4 #"-3.01 dB" at 0.5,-7 r

# Draw a separator between passband and stopband and label them
set arrow 3 from 1,-105 to 1,15 as 2

# Label coordinates are relative to the graph window, not to the function, centered at the 1/4 and 3/4 width points
set label 1 "Passband" at graph 0.25, graph 0.5 c
set label 2 "Stopband" at graph 0.75, graph 0.5 c

# Draw slope lines and label
unset arrow 6 #from 100,-20 to 12,-20 as 3
unset arrow 7 #from 100,-20 to 100,-39 as 3
unset label 5 #"Slope: -20 dB/decade" at 100,-18 c

plot P(x) ls 1 title "Phase response"

unset multiplot
|


|
File:Butterworth filter bode plot.svg fitxategi honen bektore bertsioa da. Hau rasterizatutako bertsioaren ordez erabili beharko litzateke hobea izatekotan.
File:Butterworth filter bode plot.png → File:Butterworth filter bode plot.svg
Grafiko bektorialei buruzko informazioa lortzeko, irakurri SVGra trantsizioa Commonsen. MediaWikiko SVG irudien inguruko laguntza teknikoa ere badago. |
 |
Lizentzia
Nik, lan honen egileak, argitaratzen dut ondorengo lizentzia hauen pean:
This file is licensed under the Creative Commons Attribution-Share Alike 3.0 Unported, 2.5 Generic, 2.0 Generic and 1.0 Generic license.
- Askea zara:
- partekatzeko – lana kopiatzeko, banatzeko eta bidaltzeko
- birnahasteko – lana moldatzeko
- Ondorengo baldintzen pean:
- eskuduntza – Egiletza behar bezala aitortu behar duzu, lizentzia ikusteko esteka gehitu, eta ea aldaketak egin diren aipatu. Era egokian egin behar duzu hori guztia, baina inola ere ez egileak zure lana edo zure erabilera babesten duela irudikatuz.
- berdin partekatu – Lan honetan oinarrituta edo aldatuta berria eraikitzen baduzu, emaitza lana hau bezalako lizentzia batekin argitaratu behar duzu.

|
Baimena duzu dokumentu hau kopiatu, banatu edo/eta aldatzeko GNU Free Documentation License baldintzapean, Free Software Foundationek argitaratutako 1.2 edo ondorengo bertsioan; sekzio aldaezinik gabe, azaleko testurik gabe, eta atzeko azaleko testurik gabe. Lizentziaren kopia dago GNU Free Documentation License izenburudun atalean. |
Nahiago duzun lizentzia erabil dezakezu.
Fitxategiaren historia
Data/orduan klik egin fitxategiak orduan zuen itxura ikusteko.
| Data/Ordua | Iruditxoa | Neurriak | Erabiltzailea | Iruzkina | |
|---|---|---|---|---|---|
| oraingoa | 22:01, 8 urria 2005 | | 1.250 × 875 (110 KB) | Omegatron | last revision? |
| 21:41, 8 urria 2005 |  | 1.250 × 875 (113 KB) | Omegatron | better | |
| 21:30, 8 urria 2005 |  | 1.250 × 875 (117 KB) | Omegatron | The frequency response of a Butterworth filter with logarithmic axes (Bode plot) and various labels. Cutoff frequency is normalized to 1 rad/s. Gain is |
Irudira dakarten loturak
Hurrengo orrialdeek dute fitxategi honetarako lotura:
Fitxategiaren erabilera orokorra
Hurrengo beste wikiek fitxategi hau darabilte:
- eo.wikipedia.org proiektuan duen erabilera
- fr.wikipedia.org proiektuan duen erabilera
- he.wikipedia.org proiektuan duen erabilera
- hi.wikipedia.org proiektuan duen erabilera
- nn.wikipedia.org proiektuan duen erabilera
- pl.wikipedia.org proiektuan duen erabilera
- pt.wikipedia.org proiektuan duen erabilera
- zh.wikipedia.org proiektuan duen erabilera