
Fitxategi:Simpson's paradox continuous.svg

Bereizmen handikoa (SVG fitxategia, nominaldi 390 × 260 pixel, fitxategiaren tamaina: 18 KB)
Fitxategi hau Wikimedia Commonsekoa da. Hango deskribapen orriko informazioa behean duzu. |
Laburpena
| Deskribapena |
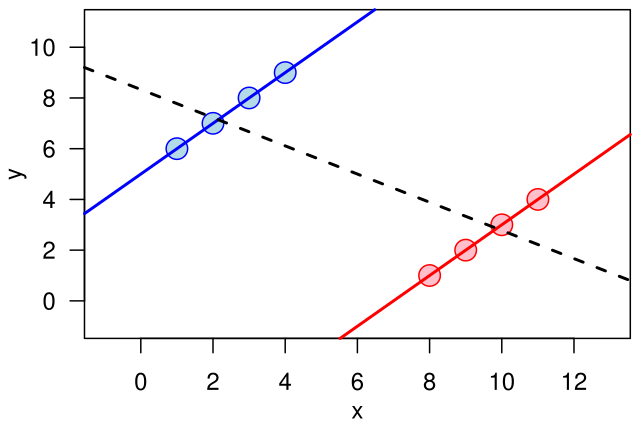
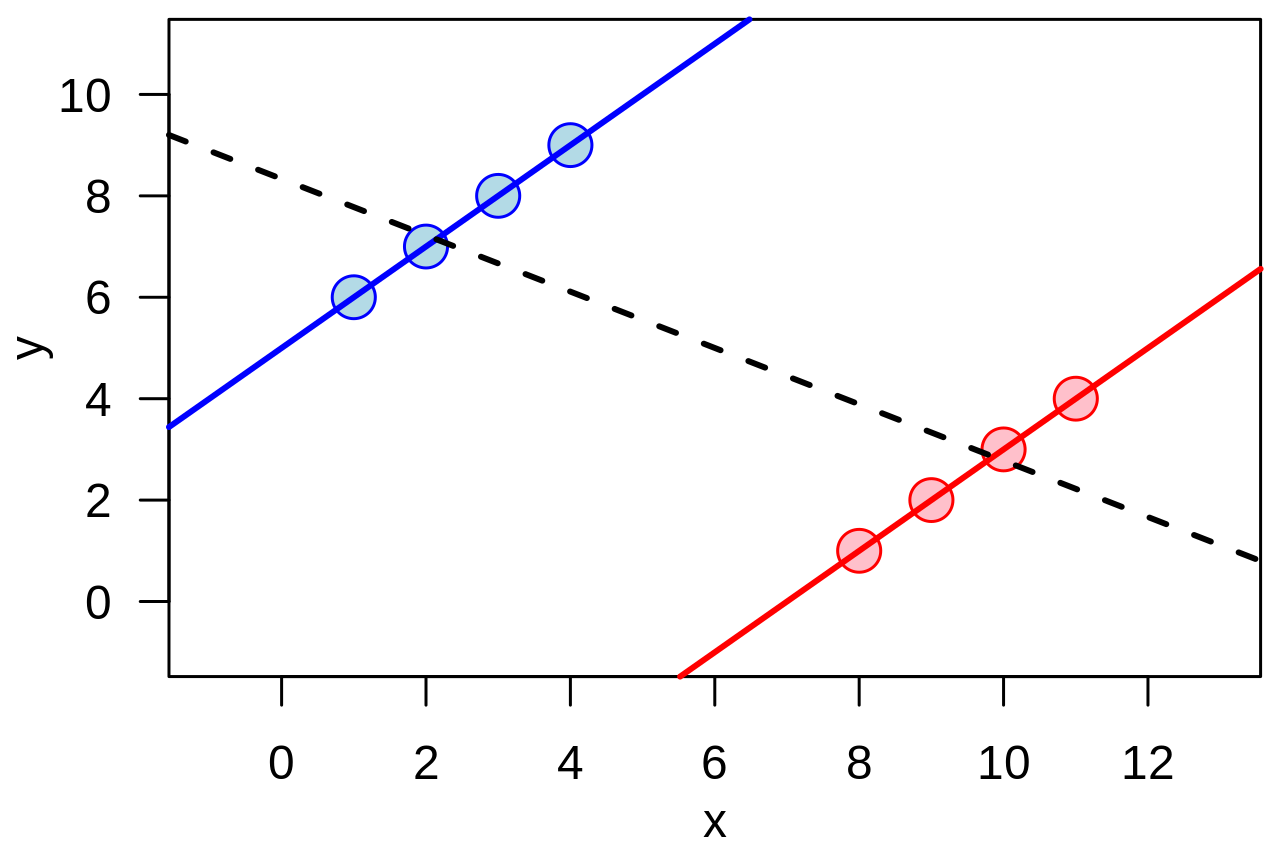
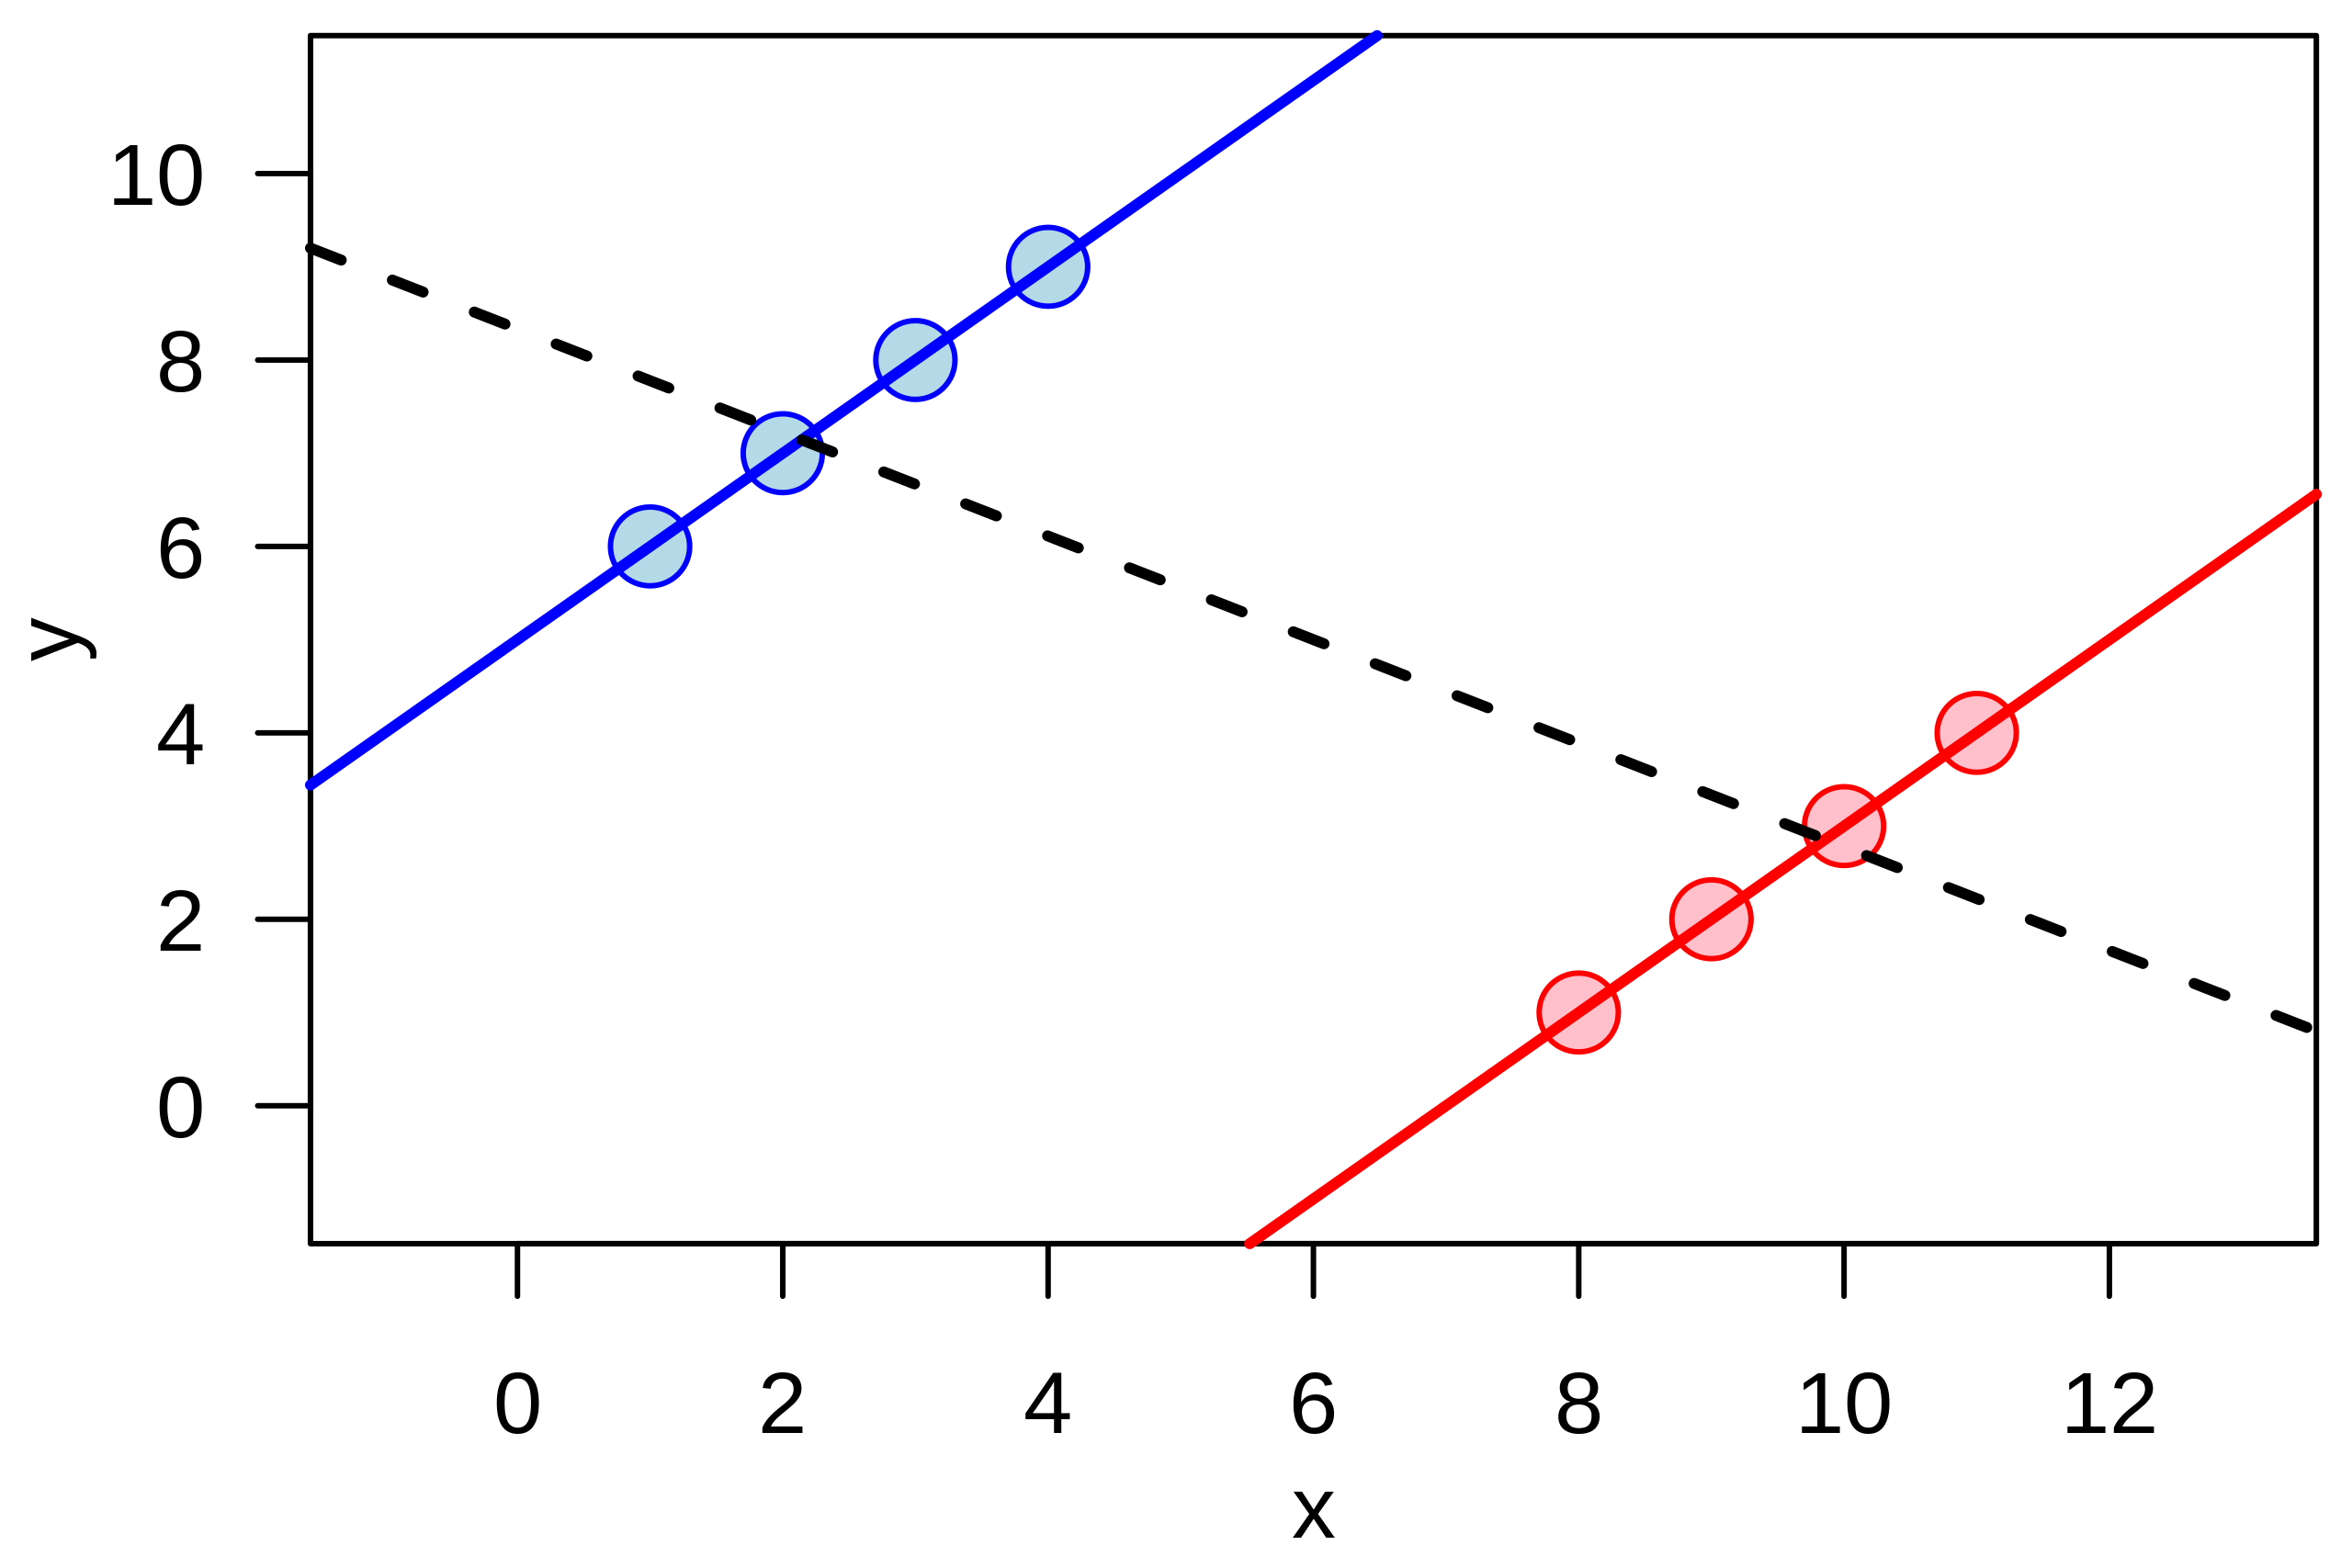
English: Illustration of the quantitative version of en:Simpson's paradox: a positive trend appears for two separate groups (blue and red), whereas a negative trend (black, dashed) appears when the groups are combined. |
| Data | |
| Jatorria | Norberak egina |
| Egilea | Schutz |
Example of the quantitative version of w:Simpson's paradox.
The graphic was created by User:Schutz for Wikipedia on 14 June 2007, using the R statistical project. The program that generated and exported the graphic is given below; the uploaded version was generated slightly differently to workaround a bug during the PS to SVG conversion with pstoedit command. The layout was slightly modified using Inkscape before upload.
  x1 <- c(1,2,3,4)
  y1 <- x1 + 5

  x2 <- x1 + 7
  y2 <- x2 - 7

  x <- c(x1,x2)
  y <- c(y1,y2)

  postscript("simpson.eps", paper="special", width=4.5, height=3)

  par(las=1)
  par(mar=c(3,3,0.5,0.5))
  par(mgp=c(2,1,0))

  plot(x,y, cex=2, pch=21,
       col=rep(c("blue", "red"), each=4), bg=rep(c("lightblue", "pink"), each=4),
       xlim=range(x)+c(-2,2), ylim=range(y)+c(-2,2))
  abline(lm(y1 ~ x1), col="blue", lwd=2)
  abline(lm(y2 ~ x2), col="red", lwd=2)
  abline(lm(y  ~ x), lwd=2, lty=2)

  dev.off()
Lizentzia
| This work has been released into the public domain by its author, I, Schutz. This applies worldwide. Estatu batzuetan beharbada hori ez da legez posible izango. Halakoetan: I, Schutz grants anyone the right to use this work for any purpose, without any conditions, unless such conditions are required by law. |
Fitxategiaren historia
Data/orduan klik egin fitxategiak orduan zuen itxura ikusteko.
| Data/Ordua | Iruditxoa | Neurriak | Erabiltzailea | Iruzkina | |
|---|---|---|---|---|---|
| oraingoa | 01:15, 14 ekaina 2007 | | 390 × 260 (18 KB) | Schutz | {{Information |Description=Illustration of the continuous version of Simpson's paradox |Source=self-made |Date=14 June 2007 |Author=Schutz }} Example of the continuous version of w:Simpson's paradox. The graphic was created by [[User |
Irudira dakarten loturak
Hurrengo orrialdeek dute fitxategi honetarako lotura:
Fitxategiaren erabilera orokorra
Hurrengo beste wikiek fitxategi hau darabilte:
- ar.wikipedia.org proiektuan duen erabilera
- ca.wikipedia.org proiektuan duen erabilera
- cs.wikipedia.org proiektuan duen erabilera
- cy.wikipedia.org proiektuan duen erabilera
- de.wikipedia.org proiektuan duen erabilera
- en.wikipedia.org proiektuan duen erabilera
- es.wikipedia.org proiektuan duen erabilera
- fi.wikipedia.org proiektuan duen erabilera
- fr.wikipedia.org proiektuan duen erabilera
- he.wikipedia.org proiektuan duen erabilera
- ko.wikipedia.org proiektuan duen erabilera
- nl.wikipedia.org proiektuan duen erabilera
- no.wikipedia.org proiektuan duen erabilera
- pl.wikipedia.org proiektuan duen erabilera
- pt.wikipedia.org proiektuan duen erabilera
- ru.wikipedia.org proiektuan duen erabilera
- sk.wikipedia.org proiektuan duen erabilera
- ta.wikipedia.org proiektuan duen erabilera
- uk.wikipedia.org proiektuan duen erabilera
- vi.wikipedia.org proiektuan duen erabilera
- www.wikidata.org proiektuan duen erabilera
- zh.wikipedia.org proiektuan duen erabilera