
Fitxategi:Vostok Petit data.svg

Bereizmen handikoa (SVG fitxategia, nominaldi 1.024 × 768 pixel, fitxategiaren tamaina: 81 KB)
Fitxategi hau Wikimedia Commonsekoa da. Hango deskribapen orriko informazioa behean duzu. |
Laburpena
| Deskribapena |
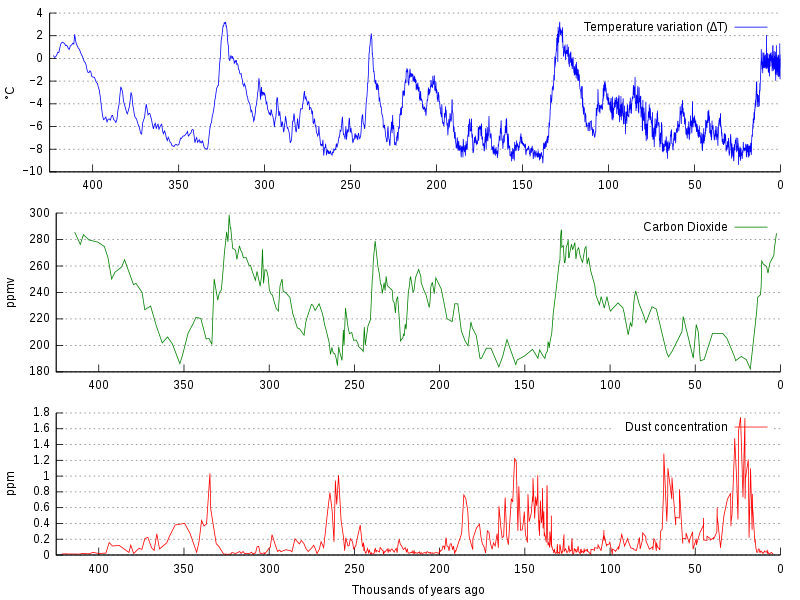
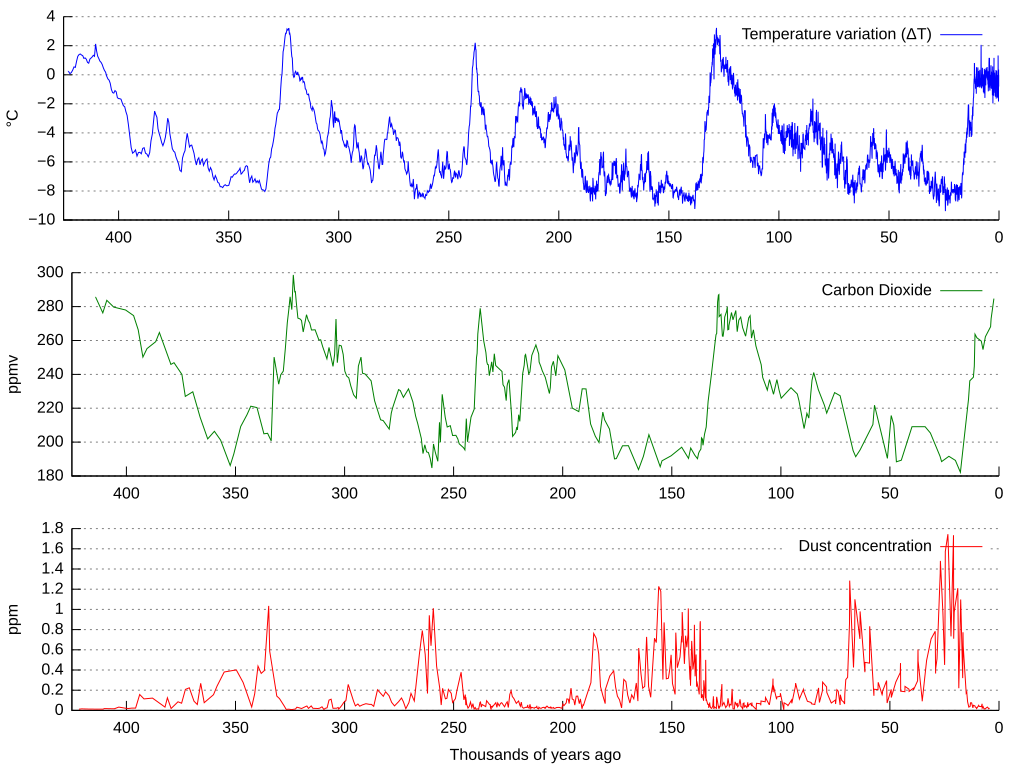
La bildo estas kopiita de wikipedia:en. La originala priskribo estas: Graph of CO2 (Green graph), temperature (Blue graph), and dust concentration (Red graph) measured from the Vostok, Antarctica ice core as reported by Petit et al., 1999. Higher dust levels are believed to be caused by cold, dry periods. The Earth's orbital eccentricity, tilt, and precession vary in a pattern over thousands of years. The IPCC notes that Milankovitch cycles drove the ice age cycles; CO2 followed temperature change "with a lag of some hundreds of years" (visible on a graph more zoomed in than this); and that as a feedback amplified temperature change. Among other factors, CO2 is more soluble in colder than in warmer waters. العربية: مخطّطٌ يُبيّن علاقة ثاني أوكسيد الكاربون ودرجة الحرارة وتركيز الغبار في قالب جليد فوستوك (بالإنجليزيّة: Vostok ice core) خلال 450,000 سنة الماضيّة |
| Data | |
| Jatorria | Norberaren lana, ondorengo hau(ek) oinarri hartuta: Vostok-ice-core-petit.png by NOAA |
| Egilea |
Original: Ezezaguna Bektorea: |
| Beste bertsioak |
Derivative works of this file: |
| SVG genesis | Fitxategi hau (bektore-irudia) hau Gnuplot-ekin sortu da . This file is translated using SVG switch elements: all translations are stored in the same file. |
Data sets used are:
- ftp://ftp.ncdc.noaa.gov/pub/data/paleo/icecore/antarctica/vostok/deutnat.txt
- ftp://ftp.ncdc.noaa.gov/pub/data/paleo/icecore/antarctica/vostok/co2nat.txt
- ftp://ftp.ncdc.noaa.gov/pub/data/paleo/icecore/antarctica/vostok/dustnat.txt
Iturburu kode
Gnuplot code
unset multiplot
set term svg size 1024,768
set output "vostok-data.svg"

set border 3
set xtics nomirror
set ytics nomirror
unset xlabel
unset ylabel

set grid y
set multiplot layout 3,1

set ylabel "°C"
plot [-425:0] [-10:4] \
        "deutnat.txt" \
        using (-$2/1000):4 \
        title "Temperature variation (ΔT)" \
        ls 3 \
        with lines

set ylabel "ppmv"
plot [-425:0] \
        "co2nat.txt" \
        using (-$1/1000):2 \
        title "Carbon Dioxide" \
        ls 2 \
        with lines

set xlabel "Thousands of years ago"
set ylabel "ppm"
plot [-425:0] \
        "dustnat.txt" \
        using (-$1/1000):2 \
        title "Dust concentration" \
        ls 1 \
        with lines
Explanation
After executing gnuplot, the resulting SVG file was manually changed to
* remove the negative signs for the x axis values
* change the [[:w:hyphen-minus|hyphen-minus]] characters in the temperature axis values to proper minus sign characters
| Fitxategi hau Creative Commons Attribution-Share Alike 3.0 Unported lizentziapean dago. | ||
| ||
| This licensing tag was added to this file as part of the GFDL licensing update. |

|
Baimena duzu dokumentu hau kopiatu, banatu edo/eta aldatzeko GNU Free Documentation License baldintzapean, Free Software Foundationek argitaratutako 1.2 edo ondorengo bertsioan; sekzio aldaezinik gabe, azaleko testurik gabe, eta atzeko azaleko testurik gabe. Lizentziaren kopia dago GNU Free Documentation License izenburudun atalean. |
Jatorrizko igoera erregistroa
This image is a derivative work of the following images:
- Vostok-ice-core-petit.png licensed with Cc-by-sa-3.0-migrated, GFDL
- 2006-02-15T20:38:10Z Maksim 598x441 (31557 Bytes) La bildo estas kopiita de wikipedia:en. La originala priskribo estas: Graph of [[carbon dioxide|CO2]], [[temperature]], and dust concentration measured from the [[Vostok, Antarctica]] [[ice core]] as reported by Petit et al.
Uploaded with derivativeFX
Fitxategiaren historia
Data/orduan klik egin fitxategiak orduan zuen itxura ikusteko.
| Data/Ordua | Iruditxoa | Neurriak | Erabiltzailea | Iruzkina | |
|---|---|---|---|---|---|
| oraingoa | 15:01, 25 ekaina 2021 | | 1.024 × 768 (81 KB) | Matěj Orlický | File uploaded using svgtranslate tool (https://svgtranslate.toolforge.org/). Added translation for cs. |
| 00:25, 1 abendua 2013 |  | 1.024 × 768 (77 KB) | SeL media | time axis reversed | |
| 19:39, 25 iraila 2011 |  | 1.024 × 768 (309 KB) | Hel-hama | text improved | |
| 05:07, 27 apirila 2011 |  | 1.024 × 768 (83 KB) | Awickert | Didn't realize that it was a draw-on box instead of a measuring-box. Take 3! | |
| 05:05, 27 apirila 2011 |  | 1.024 × 768 (83 KB) | Awickert | [Shoot - last time, picked original instead of new version to upload] Manually moved axes in Inkscape such that the three plots line up with one another | |
| 05:02, 27 apirila 2011 |  | 1.024 × 768 (75 KB) | Awickert | Manually moved axes in Inkscape such that the three plots line up with one another | |
| 15:25, 20 ekaina 2010 |  | 1.024 × 768 (75 KB) | Autopilot | {{Information |Description=La bildo estas kopiita de wikipedia:en. La originala priskribo estas: Graph of CO<sub>2</sub> (Green graph), temperature (Blue graph), and dust concentration (Red graph) measured from the [[Vostok, Antarc |
Irudira dakarten loturak
Hurrengo orrialdeek dute fitxategi honetarako lotura:
Fitxategiaren erabilera orokorra
Hurrengo beste wikiek fitxategi hau darabilte:
- af.wikipedia.org proiektuan duen erabilera
- ar.wikipedia.org proiektuan duen erabilera
- be.wikipedia.org proiektuan duen erabilera
- bg.wikipedia.org proiektuan duen erabilera
- ca.wikipedia.org proiektuan duen erabilera
- cs.wikipedia.org proiektuan duen erabilera
- cy.wikipedia.org proiektuan duen erabilera
- da.wikipedia.org proiektuan duen erabilera
- de.wikipedia.org proiektuan duen erabilera
- en.wikipedia.org proiektuan duen erabilera
- Climate variability and change
- Global cooling
- Ice core
- Orbital forcing
- Quaternary glaciation
- Carbon dioxide in Earth's atmosphere
- Talk:Ice age/Archive 1
- File talk:Vostok Petit data.svg
- List of periods and events in climate history
- User talk:Jc-S0CO/Archives/2013/2
- User:Mark Buchanan/sandbox/QuatGlac
- User:Mark Buchanan/sandbox/Glaciation-WIP
- Portal:Climate change
- Talk:Climate variability and change/Archive 8
- en.wikiversity.org proiektuan duen erabilera
- es.wikipedia.org proiektuan duen erabilera
- fa.wikipedia.org proiektuan duen erabilera
- fi.wikipedia.org proiektuan duen erabilera
- fi.wikiversity.org proiektuan duen erabilera
- fr.wikipedia.org proiektuan duen erabilera
- gl.wikipedia.org proiektuan duen erabilera
- ha.wikipedia.org proiektuan duen erabilera
- he.wikipedia.org proiektuan duen erabilera
- it.wikipedia.org proiektuan duen erabilera
- ja.wikipedia.org proiektuan duen erabilera
- jv.wikipedia.org proiektuan duen erabilera
Ikus fitxategi honen erabilpen global gehiago.